This summer, a group of University of New Brunswick students collaborated on a project to inform New Brunswickers about the state of the province’s economy. The goal of BoostNB, launched in 2018 and updated each year, is to provide an accessible starting point for important policy discussions. It is interdisciplinary in nature, with this year’s group of students representing a range of backgrounds including Chemical Engineering, Software Engineering, Marketing, and Finance. The work was performed under the guidance of the Vaughan Chair in Regional Economics, Dr. Herb Emery.
An online dashboard for the project, BoostNB.com, provides easy access to straight-forward, fact-based information about the New Brunswick economy. The dashboard tracks 25 goals and corresponding economic indicators, assessing whether the province is progressing toward its economic goals.
BoostNB was inspired by OneNS, which tracks Nova Scotia’s progress toward meeting the nineteen proposed goals of the 2014 Ivany Commission. Many of the New Brunswick goals have been structured from the OneNS indicators for Nova Scotia in areas such as labour, exports, and migration. These indicators have been scaled and indexed to account for differences between the two Maritime provinces.
The New Brunswick dashboard also presents unique indicators important to its own economy. Building from the Government of New Brunswick Economic Growth Plan released in Fall 2016, BoostNB includes some of the provincial government’s goals among the economic indicators for industries such as food exports, mining, forestry, and tourism. BoostNB also report on “bottom line” indicators of economic performance such as real GDP growth, private sector jobs growth, labour productivity and private sector investment.
Each indicator is accompanied by a report that describes a goal for the province and provides data analysis to evaluate whether the province is on the right track to accomplish that goal, as well as preliminary recommendations for what the province can do to stay on track.
Below, we showcase some key findings for New Brunswick manufacturing:
New Brunswick’s real GDP growth rate has not been above 2% since 2006
One goal tracked by BoostNB is “By 2028, New Brunswick will experience an upward trend that returns its GDP growth rate to [pre-] 2008 levels.” The problem to overcome is that New Brunswick’s real GDP growth rate has not been above 2% since 2006, largely due to the impacts of the 2008 recession. The status is marked as “progressing,” as the province saw an upward trend in GDP growth from 2012 to 2017. Will the economic effects of COVID-19 undo the recent progress?
Figure 1. New Brunswick Real GDP Growth Rate
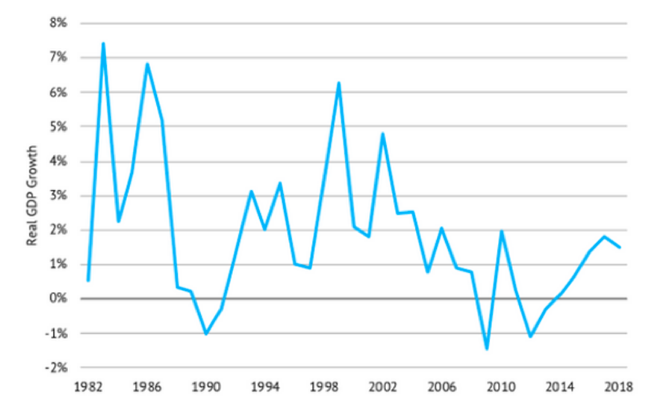
Source: BoostNB.com, “Goal 0: Real GDP Growth”
Since 2016, there has been little to no increase in the total annual value of NB exports
The most recent data shows New Brunswick is not progressing towards the goal of reaching $39.38 billion in its total annual value of exports. The value of New Brunswick’s exports drastically increased from 1981 to 2013 and then decreased until 2016. Since 2016, there has been minimal to no increase. According to BoostNB, most growth trends seen beyond 2004 have been directly impacted by the export price of petrol, oil and gas, as petrol exports are consistently New Brunswick’s top export industry.
Over the past ten years the total value of New Brunswick's fisheries and agriculture product exports has more than doubled
Most of this increase comes from the Seafood Production and Packaging sector, which makes up nearly 70% of the Agriculture and Seafood Product Exports value in the province. These upward trends have put New Brunswick on track to reach the suggested goal of achieving a total domestic export value worth at least $2 billion. In 2019, New Brunswick's seafood, crop production, and animal production exports were valued at $1.90 Billion—the highest amount on record.
In 2018, New Brunswick’s manufacturing productivity was below the national average by $16.50 per labour hour
Labour productivity is a measure of output (GDP) per labour hour. Although total labour productivity in New Brunswick has seen steady growth since 2000, manufacturing labour productivity has been creeping downward since its peak in 2004. The gap between New Brunswick’s labour productivity in manufacturing and Canada’s has been widening over the past decade.
Figure 2. Labour Productivity in Manufacturing

Source: BoostNB.ca, “Goal 15: Fisheries and Agriculture.”
GDP from New Brunswick’s forest industries has been stable since 2016
The data shows the province’s forest industries are on track to meet the goal of returning to their pre-2004 growth trend. New Brunswick’s forestry industry consists of logging, the manufacturing of pulp and paper products, and the manufacturing of wood products. Following 2004, New Brunswick faced growing global competition in the forestry sector, causing a large decline in the GDP. Continuing to contribute to this decline was the recession in 2008, which made the GDP from the forestry sector dip once again in 2009. Afterwards, however, there was growth for several years, and New Brunswick’s forest industry has had a stable level of GDP every year (~1.3 million) in 2016.
Learn more about BoostNB and see the reports for all 25 indicators.
Dr. Sarah McRae is a postdoctoral fellow at the University of New Brunswick and a member of the JDI Roundtable research team.
The JDI Roundtable on Manufacturing Competitiveness in New Brunswick is an independent research program made possible through the generosity of J.D. Irving, Ltd. The funding supports arms-length research conducted at UNB.